Acuity Brands' Q2 Outperforms Expectations

Slight miss on revenue $776M vs. $777M estimate.
Profits far outpaced expectations: $2.12 vs. $1.73 earnings per share
Intraday trading sees AYI stock rise $19.38 to $164.99 (+13.3%)
Products & Projects receiving mentions during the Earning Conference Call:
- The company has seen significant demand for the CPHB LED High Bay which is part of the Contractor Select portfolio.
- Holophane continues to see success in infrastructure projects including the recently awarded "Big Dig" relighting in Boston, MA.
- Multiple mentions of Atrius
- EvolAIR UV powered by UV Angel Clean Air Technology
- When asked about UV products, Acuity Brands CEO, Neil Ashe, discussed some of the specific products and that Acuity Brands is “eating its own cooking” by installing these technologies in the company’s facilities. He did not indicate what level of sales or demand the company sees.
Agent Network
- Independent agent sales were nearly flat; -0.7% for the Quarter ended February 28. Overall sales were -5.8%.
- Inconsistencies across geographies
- Leadership continues to be impressed with how Acuity agents have performed throughout the pandemic.
- Warehouses, Logistics and K-12 Schools mentioned as strong vertical markets.
New York, New Jersey & Philadelphia
- The change in New York, New Jersey and Philadelphia was discussed in detail.
- Ashe states that the changes demonstrate the company’s commitment to independent sales network.
- Acuity Brands believes it is better positioned to serve nationwide specifications that derive from the territory and to serve contractors in the territory.
- New York City: Ashe admitted that the company has been underperforming in North America’s largest market. He specifically cited being "constrained in the New York City market to serve projects" in which specifiers wanted non-Acuity products. Ashe didn’t elaborate further but we interpret the comments to be an apparent reference to the agents’ abilities to package Acuity Brands products with other products on a project fixture schedule – especially for out-of-territory projects.
- Ashe further cited that the change will provide increased consistency to contractors that do business across New York, New Jersey and Philadelphia.
RELATED: Acuity Brands Changes Agents in North Jersey
Price Increases
- Acuity Brands does not anticipate any drop off in demand due to price increases.
- When asked about competitors' price increases, Ashe offered no comments on whether a second increase was forthcoming, yet he also did not give any hint or indication that a second price increase was on its way.
- The company is focusing on "successful implementation of the price increase we already announced." Acuity Brands remains focused on "full capture of the price increase" that was implemented in March.
Global Electrical Components Shortage
- Will create challenges for the entire industry.
- Approximate breakdown of Acuity Brands product manufacturing by area:
- 20% finished goods imported from Asia
- 60% final assembly in Mexico
- 20% final assembly in US & Canada
Environmental, Social and Governance (ESG) factors
- Acuity Brands has "achieved 100 percent carbon neutrality in operations through a combination of carbon reduction and offsetting measures"
- The company is investing in further carbon offset programs in U.S. & Canada.
Employee Travel
Employee travel is not expected to return to pre-pandemic levels in 2021. The reference to 2021 was not specified as FY2021 which ends in August, or calendar year 2021.
Here's our understanding of the channels:
Independent Sales Network: Traditional lighting agents
Direct Sales Network: "Industrial & Holophane" as cited in the Jan 2021 earnings call
Retail Sales: Consumer retail channels, mainly home centers
Corporate Accounts: Direct sales to "National Accounts" and other large, usually multi-location, customers.
Below is the Q2 Earnings press release from Acuity Brands
ATLANTA, March 31, 2021 (GLOBE NEWSWIRE) -- Acuity Brands, Inc. (NYSE: AYI) (the "Company") a market-leading industrial technology company announced net sales of $776.6 million for the second quarter of fiscal 2021 ended February 28, 2021, a decrease of $47.6 million or 5.8 percent, as compared to the second quarter of fiscal 2020. Diluted earnings per share was $1.74, an increase of 20.8 percent over prior year and adjusted diluted earnings per share was $2.12 per share, an increase of 15.2 percent over prior year.
"I am very proud of our team for another quarter of solid performance. We continue to see signs of a modest recovery in the wider market, while our margin expansion reflects the hard work of our associates who continue to control costs in a more consistent and predictable way," stated Neil Ashe, Chief Executive Officer of Acuity Brands. "Earlier this month, we advanced our sustainability journey and highlighted our ongoing commitment to the environment, our people, and our communities, with the announcement that we had achieved carbon neutrality in our operations."
Gross profit of $336.7 million declined $7.2 million, or 2.1 percent, as compared to the prior year. Gross profit was 43.4 percent of net sales for the second quarter of fiscal 2021, an increase of approximately 170 basis points from 41.7 percent in the second quarter of fiscal 2020. The decline in gross profit was primarily due to the impact of lower sales volume, while the improvement in gross profit margin was the result of ongoing product and productivity improvements.
Operating profit of $91.0 million increased $9.6 million, or 11.8 percent as compared to prior year. Operating profit was 11.7 percent of net sales for the second quarter of fiscal 2021, an increase of 180 basis points from 9.9 percent for the second quarter of fiscal 2020. The improvement in operating profit margin was largely driven by the improvement in gross profit margin and ongoing cost management.
Adjusted operating profit of $108.9 million increased $7.2 million, or 7.1 percent, for the second quarter of fiscal 2021 as compared to the prior year. Adjusted operating profit was 14.0 percent of net sales for the second quarter of fiscal 2021, an increase of 170 basis points from 12.3 percent in the second quarter of fiscal 2020.
Net income of $62.9 million increased $5.7 million, or 10.0 percent, as compared to prior year. Diluted earnings per share of $1.74 increased $0.30, or 20.8 percent, for the second quarter of fiscal 2021, as compared to $1.44 for the second quarter of fiscal 2020.
Adjusted net income of $76.7 million increased $3.6 million, or 4.9 percent, as compared to the prior year. Adjusted diluted earnings per share of $2.12 increased $0.28, or 15.2 percent, as compared to $1.84 for the second quarter of fiscal 2020.
Channel Performance
Net sales of $592.7 million in the Independent Sales Network and of $73.9 million in the Direct Sales Network were approximately flat as compared to prior year.
Retail sales of $43.0 million declined $13.8 million as compared to the prior year. This was primarily due to a strong year-over-year pre-pandemic comparison combined with a current-quarter customer inventory rebalancing.
Sales in Corporate Accounts of $26.7 million declined $28.1 million as compared to prior year. This reflects a decrease in shipments to larger retailers as they continued to defer nonessential renovations.
Cash Flow and Capital Allocation
Net cash from operating activities of $212.6 million was approximately flat, declining $2.1 million, or 1.0 percent for the first half of fiscal 2021 as compared to the prior year. During the first half of 2021, the Company repurchased 3.2 million shares of common stock for a total of $338.3 million at an average price of $104 per share. The Company had approximately 4.4 million shares remaining under its most recent authorization at the end of the second fiscal quarter of 2021. Since May of 2020, the Company has reduced the outstanding share count by approximately 10 percent.
Carbon Neutrality Statement
On March 22, 2021, the Company announced to associates that it had achieved 100 percent carbon neutrality in operations through a combination of carbon reduction and offsetting measures. The Company will continue to update the market on ongoing efforts through the EarthLIGHT report, in periodic company press releases and through the sustainability section of the Company website.
Outlook
A further discussion relating to the ongoing impact of COVID-19 and the economic recovery will take place on our fiscal 2021 second-quarter conference call.
Conference Call
As previously announced, Acuity Brands will hold a conference call today, March 31, 2021, at 10:00 a.m. ET to discuss its fiscal 2021 second-quarter results. Interested parties may access the call via the Investor Relations section of the Company's website at investors.acuitybrands.com to hear live or to hear a replay.
About Acuity Brands
Acuity Brands, Inc. (NYSE: AYI) is a market-leading industrial technology company. The Company designs, manufactures, and brings to market products and services that make the world more brilliant, productive, and connected including building management systems, lighting, lighting controls, and location-aware applications. Acuity Brands achieves growth through the development of innovative new products and services.
Through the Acuity Business System, Acuity Brands achieves customer-focused efficiencies that allow the Company to increase market share and deliver superior returns. The Company looks to aggressively deploy capital to grow the business and to enter attractive new verticals.
Acuity Brands is based in Atlanta, Georgia, with operations across North America, Europe, and Asia. The Company is powered by approximately 11,000 dedicated and talented associates. Visit us at www.acuitybrands.com.
Non-GAAP Financial Measures
This news release includes the following non-generally accepted accounting principles ("GAAP") financial measures: “adjusted gross profit,” “adjusted gross profit margin,” “adjusted SD&A expenses,” “adjusted SD&A expenses as a percent of net sales,” “adjusted operating profit,” “adjusted operating profit margin,” “adjusted other expense,” “adjusted net income,” “adjusted diluted EPS,” and “free cash flow ("FCF")”. These non-GAAP financial measures are provided to enhance the reader's overall understanding of the Company's current financial performance and prospects for the future. Specifically, management believes that these non-GAAP measures provide useful information to investors by excluding or adjusting items for acquisition-related items, amortization of acquired intangible assets, share-based payment expense, impairment on investment, and special charges associated with continued efforts to streamline the organization and integrate recent acquisitions. FCF is provided to enhance the reader’s understanding of the Company’s ability to generate additional cash from its business. Management typically adjusts for these items for internal reviews of performance and uses the above non-GAAP measures for baseline comparative operational analysis, decision making, and other activities. Management believes these non-GAAP measures provide greater comparability and enhanced visibility into the Company’s results of operations as well as comparability with many of its peers, especially those companies focused more on technology and software. Non-GAAP financial measures included in this news release should be considered in addition to, and not as a substitute for or superior to, results prepared in accordance with GAAP.
The most directly comparable GAAP measures for adjusted gross profit and adjusted gross profit margin are “gross profit” and “gross profit margin,” respectively, which include acquisition-related items. The most directly comparable GAAP measures for adjusted SD&A expenses and adjusted SD&A expenses as a percent of net sales are “SD&A expenses” and “SD&A expenses as a percent of net sales,” respectively, which include amortization of acquired intangible assets, share-based payment expense, and acquisition-related items. The most directly comparable GAAP measures for adjusted operating profit and adjusted operating profit margin are “operating profit” and “operating profit margin,” respectively, which include the impact of acquisition-related items, amortization of acquired intangible assets, share-based payment expense, and special charges. The most directly comparable GAAP measure for adjusted other expense is “other expense,” which includes an impairment of investment. The most directly comparable GAAP measures for adjusted net income and adjusted diluted EPS are “net income” and “diluted EPS,” respectively, which include the impact of acquisition-related items, amortization of acquired intangible assets, share-based payment expense, an impairment of investment, and special charges. The most directly comparable GAAP measure for FCF is “net cash provided by operating activities.” A reconciliation of each measure to the most directly comparable GAAP measure is available in this news release. The Company’s non-GAAP financial measures may not be comparable to similarly titled non-GAAP financial measures used by other companies, have limitations as an analytical tool, and should not be considered in isolation or as a substitute for GAAP financial measures. Our presentation of such measures, which may include adjustments to exclude unusual or non-recurring items, should not be construed as an inference that our future results will be unaffected by other unusual or non-recurring items.
Forward-Looking Information
This press release includes “forward-looking statements” within the meaning of Section 27A of the Securities Act of 1933, as amended, and Section 21E of the Securities Exchange Act of 1934, as amended, that are based on management’s beliefs and assumptions and information currently available to management. Forward-looking statements are subject to known and unknown risks and uncertainties, many of which may be beyond our control. We caution you that the forward-looking information presented in this press release is not a guarantee of future events, and that actual events may differ materially from those made in or suggested by the forward-looking information contained in this press release. In addition, forward-looking statements are statements other than those of historical fact and may include statements relating to goals, plans, market conditions and projections regarding Acuity Brand’s strategy, and specifically include statements made in this press release regarding: continued signs of modest recovery in the wider market, our ongoing commitment to the environment, our people, and our communities and our intention to update the market on ongoing carbon neutrality efforts through the EarthLIGHT report. Generally, forward-looking statements can be identified by the use of forward-looking terminology such as “may,” “plan,” “seek,” “comfortable with,” “will,” “expect,” “intend,” “estimate,” “anticipate,” “believe” or “continue” or the negative thereof or variations thereon or similar terminology. A number of important factors could cause actual events to differ materially from those contained in or implied by the forward-looking statements, including those factors discussed in our annual report on Form 10-K for the fiscal year ended August 31, 2020, filed on October 23, 2020 and those described from time to time in our other filings with the U.S. Securities and Exchange Commission (the “SEC”), which can be found at the SEC’s website www.sec.gov. Any forward-looking information presented herein is made only as of the date of this press release, and we do not undertake any obligation to update or revise any forward-looking information to reflect changes in assumptions, the occurrence of events, or otherwise.
ACUITY BRANDS, INC.
CONSOLIDATED BALANCE SHEETS
(In millions, except share data)
| February 28, 2021 | August 31, 2020 | |||||
| (unaudited) | ||||||
| ASSETS | ||||||
| Current assets: | ||||||
| Cash and cash equivalents | $ | 498.7 | $ | 560.7 | ||
| Accounts receivable, less reserve for doubtful accounts of $2.6 and $2.6, respectively | 448.0 | 500.3 | ||||
| Inventories | 321.3 | 320.1 | ||||
| Prepayments and other current assets | 76.1 | 58.6 | ||||
| Total current assets | 1,344.1 | 1,439.7 | ||||
| Property, plant, and equipment, net | 262.0 | 270.5 | ||||
| Operating lease right-of-use assets | 63.3 | 63.4 | ||||
| Goodwill | 1,084.2 | 1,080.0 | ||||
| Intangible assets, net | 587.2 | 605.9 | ||||
| Deferred income taxes | 2.5 | 2.7 | ||||
| Other long-term assets | 16.9 | 29.5 | ||||
| Total assets | $ | 3,360.2 | $ | 3,491.7 | ||
| LIABILITIES AND STOCKHOLDERS’ EQUITY | ||||||
| Current liabilities: | ||||||
| Accounts payable | $ | 321.5 | $ | 326.5 | ||
| Current maturities of debt | 4.0 | 24.3 | ||||
| Current operating lease liabilities | 17.3 | 17.2 | ||||
| Accrued compensation | 91.4 | 85.4 | ||||
| Other accrued liabilities | 142.1 | 164.2 | ||||
| Total current liabilities | 576.3 | 617.6 | ||||
| Long-term debt | 494.0 | 376.8 | ||||
| Long-term operating lease liabilities | 52.2 | 56.8 | ||||
| Accrued pension liabilities | 68.0 | 91.6 | ||||
| Deferred income taxes | 95.5 | 94.9 | ||||
| Self-insurance reserves | 6.8 | 6.5 | ||||
| Other long-term liabilities | 134.9 | 120.0 | ||||
| Total liabilities | 1,427.7 | 1,364.2 | ||||
| Stockholders’ equity: | ||||||
| Preferred stock, $0.01 par value; 50,000,000 shares authorized; none issued | — | — | ||||
| Common stock, $0.01 par value; 500,000,000 shares authorized; 53,985,970 and 53,885,165 issued, respectively |
0.5 | 0.5 | ||||
| Paid-in capital | 977.8 | 963.6 | ||||
| Retained earnings | 2,635.9 | 2,523.3 | ||||
| Accumulated other comprehensive loss | (118.1 | ) | (132.7 | ) | ||
| Treasury stock, at cost — 18,244,813 and 15,012,449 shares, respectively | (1,563.6 | ) | (1,227.2 | ) | ||
| Total stockholders’ equity | 1,932.5 | 2,127.5 | ||||
| Total liabilities and stockholders’ equity | $ | 3,360.2 | $ | 3,491.7 | ||
ACUITY BRANDS, INC.
CONSOLIDATED STATEMENTS OF COMPREHENSIVE INCOME (Unaudited)
(In millions, except per-share data)
| Three Months Ended | Six Months Ended | ||||||||||||
| February 28, 2021 |
February 29, 2020 |
February 28, 2021 |
February 29, 2020 |
||||||||||
| Net sales | $ | 776.6 | $ | 824.2 | $ | 1,568.6 | $ | 1,658.9 | |||||
| Cost of products sold | 439.9 | 480.3 | 899.5 | 959.2 | |||||||||
| Gross profit | 336.7 | 343.9 | 669.1 | 699.7 | |||||||||
| Selling, distribution, and administrative expenses | 245.4 | 260.9 | 491.4 | 526.2 | |||||||||
| Special charges | 0.3 | 1.6 | 1.0 | 8.5 | |||||||||
| Operating profit | 91.0 | 81.4 | 176.7 | 165.0 | |||||||||
| Other expense: | |||||||||||||
| Interest expense, net | 6.6 | 5.7 | 11.5 | 14.0 | |||||||||
| Miscellaneous expense, net | 2.2 | 1.0 | 3.8 | 2.4 | |||||||||
| Total other expense | 8.8 | 6.7 | 15.3 | 16.4 | |||||||||
| Income before income taxes | 82.2 | 74.7 | 161.4 | 148.6 | |||||||||
| Income tax expense | 19.3 | 17.5 | 38.9 | 34.4 | |||||||||
| Net income | $ | 62.9 | $ | 57.2 | $ | 122.5 | $ | 114.2 | |||||
| Earnings per share: | |||||||||||||
| Basic earnings per share | $ | 1.75 | $ | 1.45 | $ | 3.32 | $ | 2.89 | |||||
| Basic weighted average number of shares outstanding | 36.0 | 39.5 | 36.9 | 39.5 | |||||||||
| Diluted earnings per share | $ | 1.74 | $ | 1.44 | $ | 3.30 | $ | 2.88 | |||||
| Diluted weighted average number of shares outstanding | 36.2 | 39.7 | 37.1 | 39.7 | |||||||||
| Dividends declared per share | $ | 0.13 | $ | 0.13 | $ | 0.26 | $ | 0.26 | |||||
| Comprehensive income: | |||||||||||||
| Net income | $ | 62.9 | $ | 57.2 | $ | 122.5 | $ | 114.2 | |||||
| Other comprehensive income (loss) items: | |||||||||||||
| Foreign currency translation adjustments | 6.7 | (3.7 | ) | 11.3 | (1.8 | ) | |||||||
| Defined benefit plans, net of tax | 1.7 | 1.7 | 3.3 | 3.6 | |||||||||
| Other comprehensive income (loss) items, net of tax | 8.4 | (2.0 | ) | 14.6 | 1.8 | ||||||||
| Comprehensive income | $ | 71.3 | $ | 55.2 | $ | 137.1 | $ | 116.0 | |||||
ACUITY BRANDS, INC.
CONSOLIDATED STATEMENTS OF CASH FLOWS (Unaudited)
(In millions)
| Six Months Ended | ||||||
| February 28, 2021 | February 29, 2020 | |||||
| Cash flows from operating activities: | ||||||
| Net income | $ | 122.5 | $ | 114.2 | ||
| Adjustments to reconcile net income to net cash flows from operating activities: | ||||||
| Depreciation and amortization | 50.0 | 49.8 | ||||
| Share-based payment expense | 15.2 | 24.7 | ||||
| Asset impairment | 4.0 | — | ||||
| Accounts receivable | 54.5 | 66.9 | ||||
| Inventories | (0.4 | ) | 8.3 | |||
| Prepayments and other current assets | (7.6 | ) | (4.0 | ) | ||
| Accounts payable | (4.3 | ) | (12.3 | ) | ||
| Other | (21.3 | ) | (32.9 | ) | ||
| Net cash provided by operating activities | 212.6 | 214.7 | ||||
| Cash flows from investing activities: | ||||||
| Purchases of property, plant, and equipment | (21.2 | ) | (24.9 | ) | ||
| Proceeds from sale of property, plant, and equipment | 0.4 | 0.2 | ||||
| Acquisition of businesses, net of cash acquired | — | (302.9 | ) | |||
| Other investing activities | (3.1 | ) | (1.9 | ) | ||
| Net cash used for investing activities | (23.9 | ) | (329.5 | ) | ||
| Cash flows from financing activities: | ||||||
| Issuance of long-term debt | 493.9 | 400.0 | ||||
| Repayments of long-term debt | (397.1 | ) | (350.5 | ) | ||
| Repurchases of common stock | (338.3 | ) | — | |||
| Proceeds from stock option exercises and other | 0.9 | 0.5 | ||||
| Payments of taxes withheld on net settlement of equity awards | (3.3 | ) | (4.7 | ) | ||
| Dividends paid | (9.7 | ) | (10.4 | ) | ||
| Net cash (used for) provided by financing activities | (253.6 | ) | 34.9 | |||
| Effect of exchange rate changes on cash and cash equivalents | 2.9 | (0.5 | ) | |||
| Net change in cash and cash equivalents | (62.0 | ) | (80.4 | ) | ||
| Cash and cash equivalents at beginning of period | 560.7 | 461.0 | ||||
| Cash and cash equivalents at end of period | $ | 498.7 | $ | 380.6 | ||
ACUITY BRANDS, INC.
DISAGGREGATED NET SALES
(In millions)
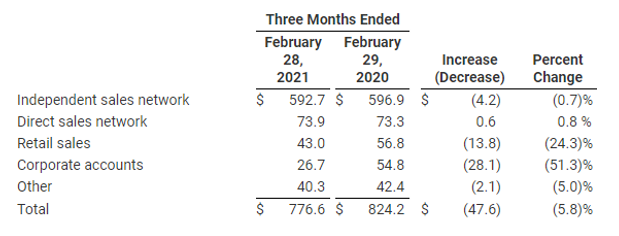
The following table shows net sales by channel for the periods presented:
| Three Months Ended | |||||||||||
| February 28, 2021 |
February 29, 2020 |
Increase (Decrease) |
Percent Change |
||||||||
| Independent sales network | $ | 592.7 | $ | 596.9 | $ | (4.2 | ) | (0.7 | )% | ||
| Direct sales network | 73.9 | 73.3 | 0.6 | 0.8 | % | ||||||
| Retail sales | 43.0 | 56.8 | (13.8 | ) | (24.3 | )% | |||||
| Corporate accounts | 26.7 | 54.8 | (28.1 | ) | (51.3 | )% | |||||
| Other | 40.3 | 42.4 | (2.1 | ) | (5.0 | )% | |||||
| Total | $ | 776.6 | $ | 824.2 | $ | (47.6 | ) | (5.8 | )% | ||
| Six Months Ended | |||||||||||
| February 28, 2021 |
February 29, 2020 |
Increase (Decrease) |
Percent Change |
||||||||
| Independent sales network | $ | 1,192.2 | $ | 1,214.9 | $ | (22.7 | ) | (1.9 | )% | ||
| Direct sales network | 150.2 | 157.6 | (7.4 | ) | (4.7 | )% | |||||
| Retail sales | 98.0 | 110.2 | (12.2 | ) | (11.1 | )% | |||||
| Corporate accounts | 50.7 | 88.3 | (37.6 | ) | (42.6 | )% | |||||
| Other | 77.5 | 87.9 | (10.4 | ) | (11.8 | )% | |||||
| Total | $ | 1,568.6 | $ | 1,658.9 | $ | (90.3 | ) | (5.4 | )% | ||
ACUITY BRANDS, INC.
Reconciliation of Non-U.S. GAAP Measures
The tables below reconcile certain GAAP financial measures to the corresponding non-GAAP measures:
| (In millions except per share data) | Three Months Ended | |||||||||
| February 28, 2021 |
February 29, 2020 |
Increase (Decrease) |
Percent Change |
|||||||
| Net sales | $ | 776.6 | $ | 824.2 | $ | (47.6 | ) | (5.8 | )% | |
| Gross profit (GAAP) | $ | 336.7 | $ | 343.9 | $ | (7.2 | ) | (2.1 | )% | |
| Percent of net sales | 43.4 | % | 41.7 | % | 170 | bps | ||||
| Add-back: Acquisition-related items (1) | — | 0.1 | ||||||||
| Adjusted gross profit (Non-GAAP) | $ | 336.7 | $ | 344.0 | $ | (7.3 | ) | (2.1 | )% | |
| Percent of net sales | 43.4 | % | 41.7 | % | 170 | bps | ||||
| Selling, distribution, and administrative (SD&A) expenses (GAAP) | $ | 245.4 | $ | 260.9 | $ | (15.5 | ) | (5.9 | )% | |
| Percent of net sales | 31.6 | % | 31.7 | % | (10 | ) | bps | |||
| Less: Amortization of acquired intangible assets | (10.1 | ) | (10.4 | ) | ||||||
| Less: Share-based payment expense | (7.5 | ) | (8.0 | ) | ||||||
| Less: Acquisition-related items (1) | — | (0.2 | ) | |||||||
| Adjusted SD&A expenses (Non-GAAP) | $ | 227.8 | $ | 242.3 | $ | (14.5 | ) | (6.0 | )% | |
| Percent of net sales | 29.3 | % | 29.4 | % | (10 | ) | bps | |||
| Operating profit (GAAP) | $ | 91.0 | $ | 81.4 | $ | 9.6 | 11.8 | % | ||
| Percent of net sales | 11.7 | % | 9.9 | % | 180 | bps | ||||
| Add-back: Amortization of acquired intangible assets | 10.1 | 10.4 | ||||||||
| Add-back: Share-based payment expense | 7.5 | 8.0 | ||||||||
| Add-back: Acquisition-related items (1) | — | 0.3 | ||||||||
| Add-back: Special charges | 0.3 | 1.6 | ||||||||
| Adjusted operating profit (Non-GAAP) | $ | 108.9 | $ | 101.7 | $ | 7.2 | 7.1 | % | ||
| Percent of net sales | 14.0 | % | 12.3 | % | 170 | bps | ||||
| Net income (GAAP) | $ | 62.9 | $ | 57.2 | $ | 5.7 | 10.0 | % | ||
| Add-back: Amortization of acquired intangible assets | 10.1 | 10.4 | ||||||||
| Add-back: Share-based payment expense | 7.5 | 8.0 | ||||||||
| Add-back: Acquisition-related items (1) | — | 0.3 | ||||||||
| Add-back: Special charges | 0.3 | 1.6 | ||||||||
| Total pre-tax adjustments to net income | 17.9 | 20.3 | ||||||||
| Income tax effects | (4.1 | ) | (4.4 | ) | ||||||
| Adjusted net income (Non-GAAP) | $ | 76.7 | $ | 73.1 | $ | 3.6 | 4.9 | % | ||
| Diluted earnings per share (GAAP) | $ | 1.74 | $ | 1.44 | $ | 0.30 | 20.8 | % | ||
| Adjusted diluted earnings per share (Non-GAAP) | $ | 2.12 | $ | 1.84 | $ | 0.28 | 15.2 | % | ||
(1) Acquisition-related items include profit in inventory and professional fees.
| (In millions, except per share data) | Six Months Ended | |||||||||
| February 28, 2021 |
February 29, 2020 |
Increase (Decrease) |
Percent Change |
|||||||
| Net sales | $ | 1,568.6 | $ | 1,658.9 | $ | (90.3 | ) | (5.4 | )% | |
| Gross profit (GAAP) | $ | 669.1 | $ | 699.7 | $ | (30.6 | ) | (4.4 | )% | |
| Percent of net sales | 42.7 | % | 42.2 | % | 50 | bps | ||||
| Add-back: Acquisition-related items (1) | — | 1.2 | ||||||||
| Adjusted gross profit (Non-GAAP) | $ | 669.1 | $ | 700.9 | $ | (31.8 | ) | (4.5 | )% | |
| Percent of net sales | 42.7 | % | 42.3 | % | 40 | bps | ||||
| Selling, distribution, and administrative (SD&A) expenses (GAAP) | $ | 491.4 | $ | 526.2 | $ | (34.8 | ) | (6.6 | )% | |
| Percent of net sales | 31.3 | % | 31.7 | % | (40 | ) | bps | |||
| Less: Amortization of acquired intangible assets | (20.2 | ) | (20.0 | ) | ||||||
| Less: Share-based payment expense | (15.2 | ) | (24.7 | ) | ||||||
| Less: Acquisition-related items (1) | — | (1.3 | ) | |||||||
| Adjusted SD&A expenses (Non-GAAP) | $ | 456.0 | $ | 480.2 | $ | (24.2 | ) | (5.0 | )% | |
| Percent of net sales | 29.1 | % | 28.9 | % | 20 | bps | ||||
| Operating profit (GAAP) | $ | 176.7 | $ | 165.0 | $ | 11.7 | 7.1 | % | ||
| Percent of net sales | 11.3 | % | 9.9 | % | 140 | bps | ||||
| Add-back: Amortization of acquired intangible assets | 20.2 | 20.0 | ||||||||
| Add-back: Share-based payment expense | 15.2 | 24.7 | ||||||||
| Add-back: Acquisition-related items (1) | — | 2.5 | ||||||||
| Add-back: Special charges | 1.0 | 8.5 | ||||||||
| Adjusted operating profit (Non-GAAP) | $ | 213.1 | $ | 220.7 | $ | (7.6 | ) | (3.4 | )% | |
| Percent of net sales | 13.6 | % | 13.3 | % | 30 | bps | ||||
| Other expense (income) (GAAP) | $ | 15.3 | $ | 16.4 | $ | (1.1 | ) | (6.7 | )% | |
| Less: Impairment of investment | (4.0 | ) | — | |||||||
| Adjusted other expense (income) (Non-GAAP) | $ | 11.3 | $ | 16.4 | $ | (5.1 | ) | (31.1 | )% | |
| Net income (GAAP) | $ | 122.5 | $ | 114.2 | $ | 8.3 | 7.3 | % | ||
| Add-back: Amortization of acquired intangible assets | 20.2 | 20.0 | ||||||||
| Add-back: Share-based payment expense | 15.2 | 24.7 | ||||||||
| Add-back: Acquisition-related items (1) | — | 2.5 | ||||||||
| Add-back: Special charges | 1.0 | 8.5 | ||||||||
| Add-back: Impairment of investment | 4.0 | — | ||||||||
| Total pre-tax adjustments to net income | 40.4 | 55.7 | ||||||||
| Income tax effect | (9.3 | ) | (12.6 | ) | ||||||
| Adjusted net income (Non-GAAP) | $ | 153.6 | $ | 157.3 | $ | (3.7 | ) | (2.4 | )% | |
| Diluted earnings per share (GAAP) | $ | 3.30 | $ | 2.88 | $ | 0.42 | 14.6 | % | ||
| Adjusted diluted earnings per share (Non-GAAP) | $ | 4.14 | $ | 3.97 | $ | 0.17 | 4.3 | % | ||
______________________________
(1) Acquisition-related items include profit in inventory and professional fees.
| (In millions except per share data) | Six Months Ended | |||||||||
| February 28, 2021 |
February 29, 2020 |
Increase (Decrease) |
Percent Change |
|||||||
| Net cash provided by operating activities (GAAP) | $ | 212.6 | $ | 214.7 | $ | (2.1 | ) | (1.0 | )% | |
| Less: Purchases of property, plant, and equipment | (21.2 | ) | (24.9 | ) | ||||||
| Free cash flow (Non-GAAP) | $ | 191.4 | $ | 189.8 | $ | 1.6 | 0.8 | % | ||
Investor Contact:
Charlotte McLaughlin
Vice President, Investor Relations
(404) 853-1456
[email protected]
Media Contact:
Candace Flippin Steele
Chief Communications Officer
[email protected]
Don’t miss the next big lighting story…Click here to subscribe to the inside.lighting InfoLetter |