May 19, 2026
NASA Maps Confirm The World Is Both Brighter And Darker

Global light levels climbed even as key regions reduced nighttime light output
In recent years, astronomers and dark-sky advocates have told a story about what we can no longer see from Earth. Stand outside almost any populated area tonight and look up. The night sky, for most of human history a source of wonder and navigation, has faded to a washed-out haze for much of the world. Light at night, it turns out, is a story we have often told by looking up.
Then NASA pointed the camera the other direction.
A landmark study recently published in Nature, built on nearly a decade of daily satellite imagery from NASA's Black Marble program, has upended a decades-old assumption: that electric illumination at night was on a slow, steady, one-directional march upward. The reality is considerably more nuanced. Brightening and dimming are happening simultaneously, often within the same country, and the pace of both is accelerating.
The Headline Number Hides The Story
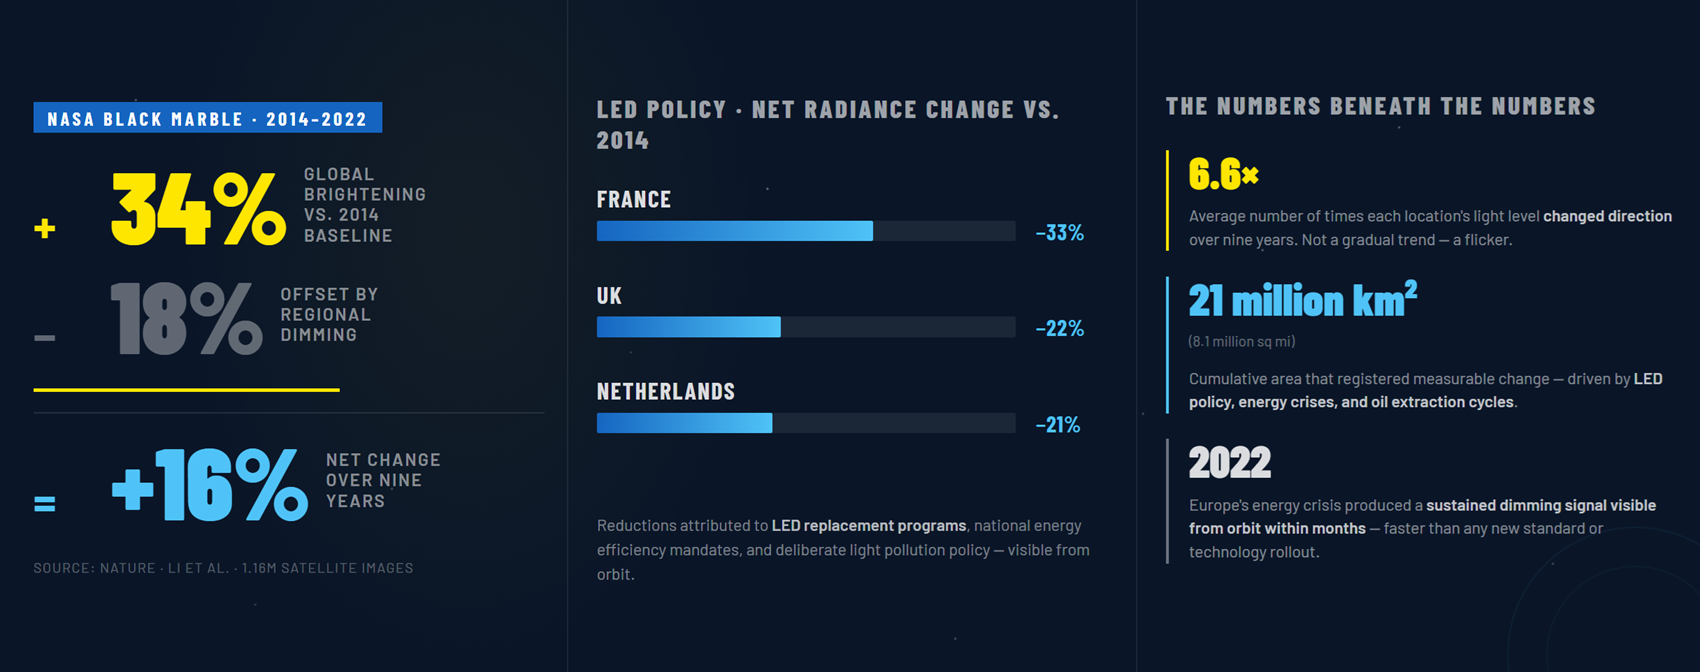
The study, led by Tian Li of the University of Connecticut and co-authored by researchers from NASA Goddard, University of Maryland, Yale, Cornell, and institutions across Europe and Asia, analyzed 1.16 million daily satellite images captured between 2014 and 2022. The headline figure is a 34 percent increase in global radiance relative to the 2014 baseline. But dimming offset that by 18 percent, producing a net gain of 16 percent over nine years.
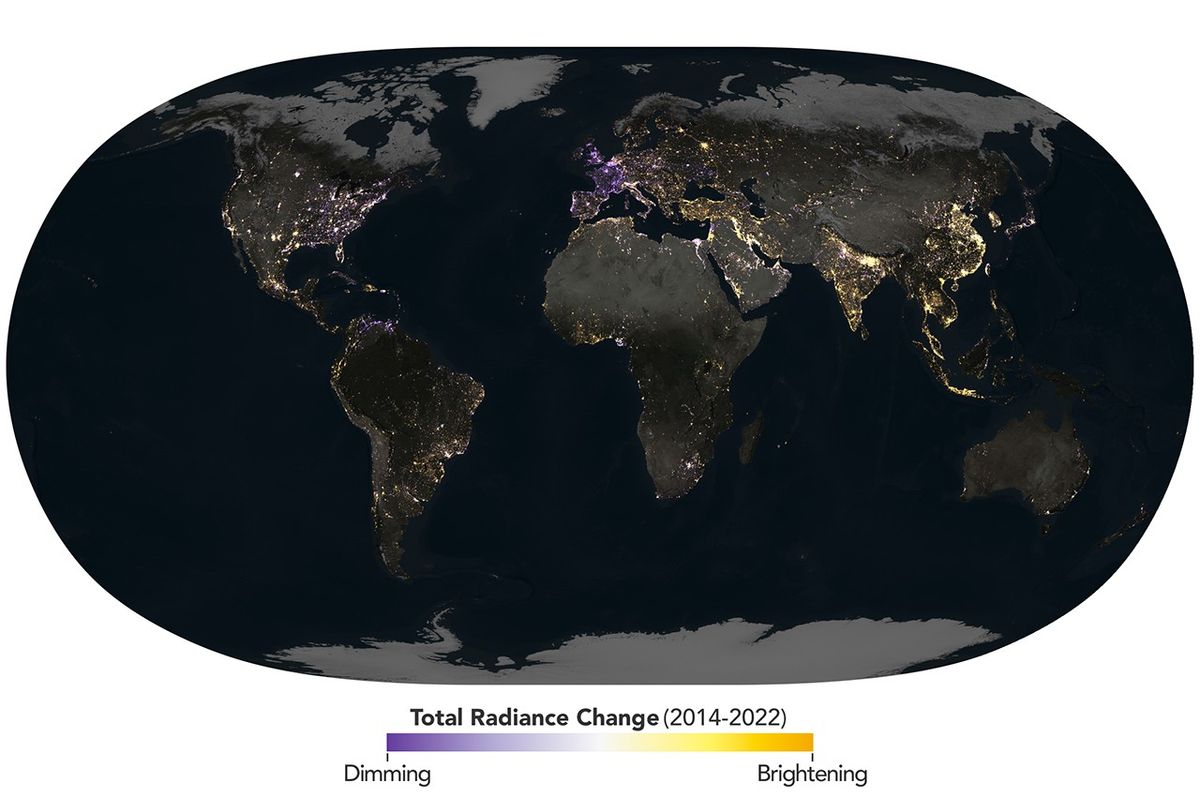
Image credit: NASA
Another revealing number is this: every location that changed at all changed an average of 6.6 times during the study period. The cumulative area of change totaled more than 21 million square kilometers. That is not a planet gradually getting brighter. That is a planet flickering.
LED Adoption And Policy Left Marks Visible From Orbit
For the lighting industry, the most directly relevant findings come from Europe and the United States.

Image credit: NASA
France recorded a 33 percent net reduction in nighttime radiance relative to its 2014 baseline. The United Kingdom came in at 22 percent. The Netherlands at 21 percent. The researchers attributed these reductions to a combination of LED replacement programs, national and EU-level energy efficiency mandates, and deliberate light pollution reduction policies.
For lighting people who have spent years building the economic and environmental case for LED adoption in institutional and municipal applications, those numbers carry weight. The ROI argument typically lives in spreadsheets, utility rebates, and lifecycle cost models. Now satellite data suggests those transitions are producing measurable nighttime dimming signatures at national scale.
The U.S. picture is more fragmented. The West Coast brightened, consistent with population growth and urban expansion in major coastal metros. Much of the East Coast and parts of the Midwest dimmed, with the researchers pointing to de-densification in older urban cores, manufacturing sector decline, and the adoption of energy-efficient lighting. Central regions told a different story: sharp brightening over Texas's Permian Basin and North Dakota's Bakken formation during drilling booms, followed by equally sharp dimming when operations contracted. The researchers noted that those light cycles track the specific phasing of extraction activity more closely than they track oil prices alone.
The Energy Crisis As A Natural Experiment
One of the study's sharpest findings concerns Europe in 2022. When the Russia-Ukraine conflict triggered an energy crisis across the continent, the satellite record shows a pronounced, sustained dimming signal beginning that year, concentrated in France, Belgium, Poland, and the Netherlands, but visible broadly across Western Europe.
Daily imagery captured what annual composites would have smoothed over: the moment European energy-saving measures took effect, and how quickly they registered in nighttime radiance. For an industry accustomed to tracking utility policy timelines, there is something clarifying in that finding. European nations reduced their nighttime light output measurably, at scale, within months, driven not by a new standard or technology breakthrough, but by the cost of energy.
COVID-19 also left a clear trace. The researchers identified a sharp, globally observable dip in electric light beginning in early 2020, driven primarily by abrupt dimming across Asia, where lockdowns arrived earliest and with particular severity. Manufacturing zones in China, industrial areas in India, commercial districts across multiple continents: all showed reductions the daily record captured with precision that monthly data would have lost.

Asia Warrants Particular Attention
China and India recorded the largest national-level increases in radiance of any countries in the study, and the cumulative area of change across the continent dwarfs every other region on the map. China's signature is especially telling: satellite data captured cycles of dimming from demolition followed by explosive brightening from vertical reconstruction, a pattern that tracks the pace of high-density urban redevelopment more than any single economic indicator.
India's brightening, concentrated in the south and tied to rural electrification programs, reflects a different kind of demand entirely: infrastructure-led, government-driven, and oriented toward access rather than commercial specification.
What The Data Suggests For The Industry
The study documents where electrification is advancing, where efficiency policy is registering, where economic instability is pulling light backward, and where industrial volatility is producing cycles of brightening and retreat. For manufacturers evaluating international markets, distributors considering stocking strategies, or ESCOs modeling project pipelines, that map has strategic texture.
The researchers found that the areas showing the most durable, sustained dimming trends are high-income regions with coherent energy policy and mature LED infrastructure. The areas with the most extreme bidirectional swings tend to be places with concentrated industrial activity, active conflict, or rapid urban redevelopment. The pattern is not random. It follows the contours of policy, investment, and institutional stability.
The bidirectional volatility is also intensifying. Both brightening and dimming grew more pronounced across the study period. The cumulative area experiencing dimming expanded by roughly 12,875 square kilometers per year. A planet in transition tends to move in more than one direction at once, and the pace of that movement is picking up. Whether the policy conditions that produced Europe's measurable dimming signal can be replicated in markets where efficiency mandates remain fragmented is a question the industry has not yet answered.