



Architecture Firms Face Another Month of Weakness

A rare bright spot for C&I as the Midwest holds firm and the Northeast slumps.
THE MOST RECENT REPORT: September 23, 2026
WASHINGTON – September 23, 2026 – In August, architecture firms continued to face soft business conditions, posting an AIA Architecture Billings Index® (ABI) score of 47.2. Although the share of firms reporting declining billings eased slightly from July, the overall trend remained downward.
Inquiries into new projects showed only modest growth this month, while the value of newly signed design contracts continued to decline. Despite an overall decline in billings, regional performance was mixed in August. Midwest firms reported modest growth for the first time in nearly a year, and billings at Western firms were essentially flat. In contrast, Northeast firms saw billings fall sharply to their lowest level since 2020. Architecture firms are growing less optimistic about future billings, with the share expecting declines rising from 21 percent at the end of the first quarter to 29 percent by the end of the third quarter.
Conditions in the broader economy also remained mixed in August. Architectural services employment increased, adding 700 new positions in July. Despite this employment growth, inflation ticked back up in August, with the Consumer Price Index (CPI) increasing by 0.4 percent from July, after rising just 0.1 percent the previous month. It remains up by 3.4 percent from one year ago, with recent increases in gasoline and energy prices among the largest contributors.
“Architecture firms are caught between stubborn inflation and higher borrowing costs,” said AIA Chief Economist Richard Branch. “The Federal Reserve’s latest rate increase may help ease inflationary pressures over time, but in the near term it adds another headwind for projects already facing a difficult financing environment.”
Key ABI highlights for August include:
- Regional averages: Midwest (50.7); West (49.8); South (46.1); Northeast (40.7)
- Sector index breakdown: commercial/industrial (50.4); multifamily residential (47.8); institutional (47.0); mixed practice (firms that do not have at least half of their billings in any one other category) (42.5)
- Project inquiries index: 50.8
- Design contracts index: 48.3
Regional and sector categories are measured as three-month moving averages and may not align with the national score.
Inside Lighting strives to accurately report certain data on the day it is reported by the AIA, but updates to past data with new three-month rolling averages might not be made. For official and most current reports, refer to the AIA ABI numbers. All ABI data is sourced from the AIA.

Interpreting the ABI:
The Architecture Billings Index (ABI) is a leading economic indicator of construction activity. It is produced by the American Institute of Architects (AIA) and it reflects the approximate nine-to-twelve month lead time between architecture billings and construction spending.
The ABI is based on a monthly survey of architecture firms that asks respondents to rate the level of their billings (or the amount of new design contracts) as either "increase," "decrease," or "no change" from the previous month. The results are then compiled into an index, where a score above 50 indicates an increase in billings, and a score below 50 indicates a decrease in billings.
The ABI is widely used in the construction industry, as well as by economists and analysts, to track the health of the construction market and to forecast future building activity. It is considered a leading economic indicator because changes in architecture billings often precede changes in overall economic activity, such as employment and GDP.
The ABI provides a snapshot of the demand for design services as well as an indication of the near-term outlook for the construction industry.
The survey panel asks participating architectural firms whether billings increased, decreased or stayed the same in the month that just ended. According to the proportion of respondents choosing each option, a score is generated, which represents an index value for each month.
- An index score of 50 indicates no change in firm billings versus the previous month.
- A score above 50 indicates an increase in firm billings versus the previous month.
- A score below 50 indicates an decrease in firm billings versus the previous month.
- NOTE: Index numbers cited for the last three reported months are preliminary.
- The regional and sector categories are calculated as a 3-month moving average, whereas the national index, design contracts and inquiries are monthly numbers.
Source: The American Institute of Architects (AIA)
National Architecture Billings Index
Source: The American Institute of Architects (AIA)
RELATED: Historical ABI Data 2008 - 2022 »
Don’t miss the next big ABI update…Click here to subscribe to the inside.lighting InfoLetter |
Regional Architecture Billings Index
(Three month rolling average)
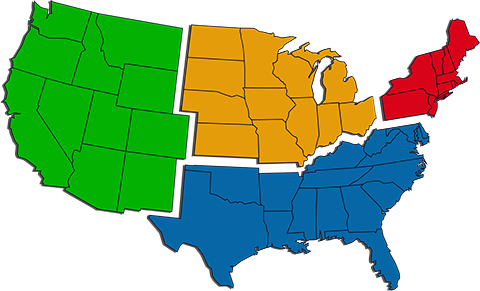
Source: The American Institute of Architects (AIA)
Sector-Specific Architecture Billings Index
Three-month rolling average
Commercial/Industrial
Buildings related to commerce and industry. Office space, banks, retail, factories, etc.
Institutional
Schools, civic/government buildings, museums, hospitals, etc.
Multifamily Residential
Town homes, apartment complexes, condominiums, etc.
Mixed Practice
Firms that do not have at least half of their billings in any one other category.

Source: The American Institute of Architects (AIA)
Architecture Billings Index® is a registered trademark of The American Institute of Architects
Don’t miss the next big ABI update…Click here to subscribe to the inside.lighting InfoLetter |