October 5, 2021   

Nine LED Brands vs. HID vs. the Sun

2021 10 Horticultural LED HID SUN high intensity discharge performance.jpg

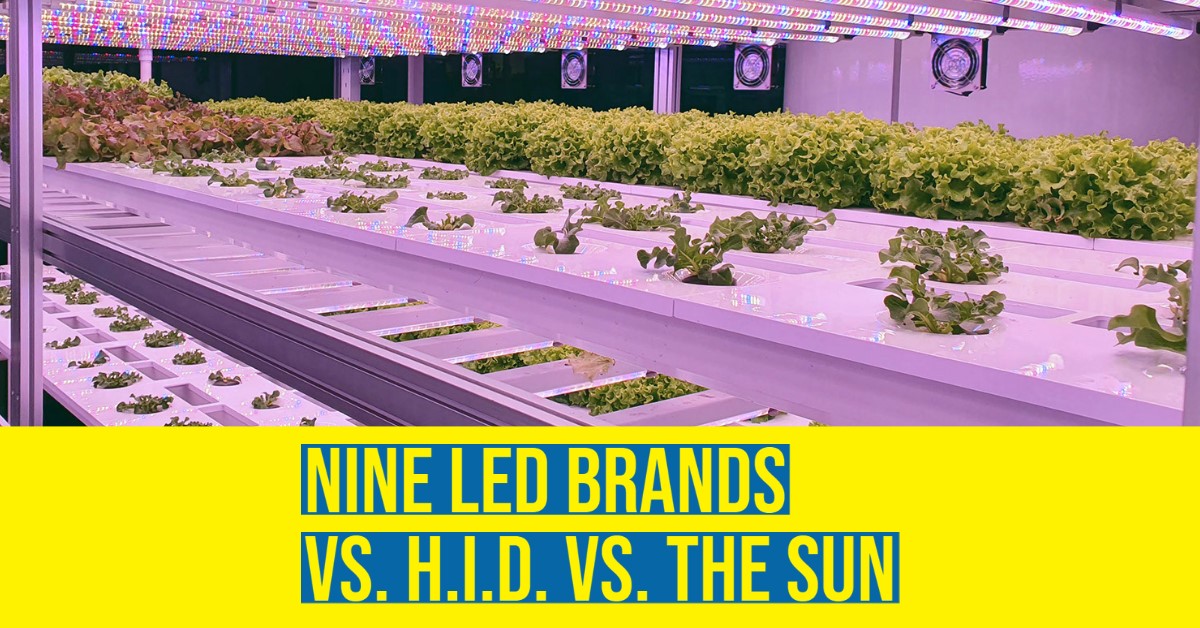
A recent study compares the performance of various horticultural lighting sources


A recently published study from researchers at Cornell University and Rutgers University emphasizes a substantial range of performance characteristics among horticultural light sources, highlighting the importance of a careful assessment before selecting a light source for horticultural applications. Some of the takeaways include:

  • The Photosynthetic Photon Flux (PPF) efficacy of a light source is but one performance characteristic that should be considered.
  • There are currently some imperfections, lack of consistency in the ways that various manufacturers report the performance characteristics of light sources, making it difficult for end users to do attribute comparisons.
  • Due to the rapidly improving LED technology, it is critically important to have a consistent system for measuring and reporting lamp characteristics.

Below is a reprint of the study:


On the Technical Performance Characteristics of Horticultural Lamps

by Timothy J. Shelford, School of Integrative Plant Science, Horticulture Section, Cornell University and Arend-Jan Both, Department of Environmental Sciences, Rutgers University

Advanced Lighting Technologies in Controlled Environment Agriculture for Production, Breeding, and Research


Recent advances in light emitting diode (LED) technology have provided exciting opportunities for plant lighting applications, and it is expected that LED lighting will soon overtake the still common use of high-intensity discharge (HID) lighting technology. Because LED lighting offers novel capabilities, extensive research is needed to identify optimal lighting practices for the large number of crops grown by commercial greenhouse growers. Plant scientists and growers facing decisions about plant lighting systems do not always have sufficient information about lamp performance characteristics.
 
In this paper, we reported on various technical performance characteristics for 18 lamp types commonly used for plant production, and compared these characteristics with the characteristics of sunlight. The results showed a substantial range of performance characteristics, highlighting the importance of a careful assessment before selecting a light source for horticultural applications. The data presented in this paper can be used to assess the suitability of a specific light source for a particular horticultural application.


1. Introduction

The rapid improvements in light emitting diode (LED) technology over the last three decades have resulted in a host of intriguing opportunities for plant lighting applications [1,2]. Before that, high-intensity discharge (HID) lighting systems were used as the most practical and cost effective option for commercial growers. As a result, the industry accumulated a lot of knowledge about how best to use HID lighting. However, LED technology has several advantages, e.g., flexibility in spectral output, higher electric conversion efficiency, and little radiant heat production. However, since LED fixtures for horticultural applications are still more expensive than comparable HID fixtures, the latter, and particularly high-pressure sodium (HPS) fixtures, are still the most dominant light source for plant lighting applications. Nevertheless, the expectation is that the use of LED lighting systems will overtake the use of HID lighting systems in the near future.
 
With the advances in LED technology come new opportunities to investigate plant responses to a host of lighting conditions that were previously difficult or impossible to study (e.g., light dimming, diurnal or seasonal changes in light spectrum, placing high-intensity light sources close to or inside the plant canopy). Not surprisingly, the scientific community has embraced LED technology and is investigating new ways to elucidate plant physiological responses (e.g., [3,4]) as well as economic benefits from potentially cheaper production practices (e.g., [5,6]). Promising results have been reported, but it will take some time before optimum lighting strategies have been worked out for the large variety of crops grown in greenhouses and indoor production facilities (e.g., [7,8]). Note that our study focused on the technical performance characteristics of lamps, and did not include any plant production trials.
 
Previous reporting by our research group [9,10,11] discussed the operating characteristics of select plant lighting sources, as well as how best to measure and report key technical metrics of light sources used for horticultural applications. The purpose of this paper was to present performance characteristics of the most commonly used light sources so that their differences in performance characteristics can be used to make better informed decisions about the most suitable light source for a particular plant production application.
Several of the light sources evaluated as part of this study are no longer manufactured (e.g., Illumitex and Lumigrow), or the specific models evaluated have been replaced by updated or new models. This issue is an important consideration for growers evaluating and selecting lighting systems and illustrates the importance of having meaningful technical data that can be used for comparisons. Instead of providing data on the latest light sources, the focus of this study was to provide performance metrics for the purpose of comparisons. Our laboratory is not a certified testing facility, nor does it have the capacity to test every lamp available in the market place. Instead, our test results attempted to fill knowledge gaps that may exist with end users of horticultural lighting technologies.
 

2. Materials and Methods
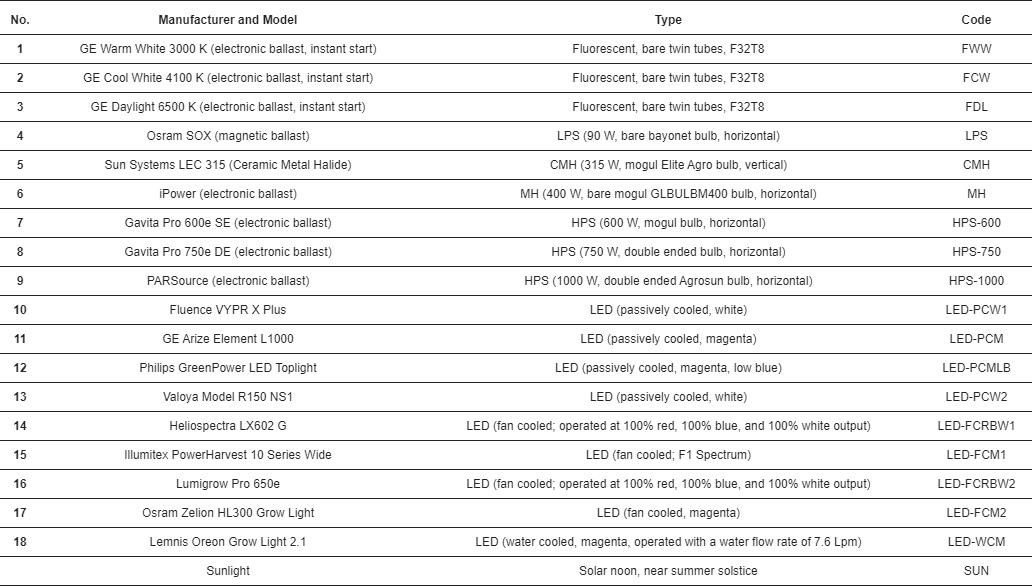
2.1. Light Sources

A variety of electric light sources commonly used for horticultural applications were evaluated. These sources included nine different LED lamps, three fluorescent lamps, three HPS lamps, a low-pressure sodium (LPS) lamp, a metal halide (MH) lamp, and a ceramic MH lamp (Table 1). While rarely used for horticultural applications, the LPS lamp was included because it has one of the highest luminous efficacy (lumen/W) values (based on lamp bulb wattage, not on fixture wattage that includes the power draw by the ballast), and has occasionally been reported on in the scientific literature when the performance of different lamp types was discussed (e.g., [12]). In addition to these electric sources, data describing sunlight were included for comparison. A scan of solar radiation was performed on a clear day close to the summer solstice at around solar noon (25 June 2015 in New Brunswick, NJ, USA).
 
Table 1. Light sources evaluated.
hortT1.png
 

2.2. Measurement Equipment

Light measurements were conducted in a 2-m diameter integrating sphere (Model LMS-760, Labsphere, North Sutton, NH, USA) connected to a spectroradiometer (Model CDS 2100, Labsphere, North Sutton, NH, USA) with a fiber-optic cable. The electric power used to operate the lamps or fixtures was conditioned using a programmable alternating current (AC) power source (Model 6460, Chroma, Foothill Ranch, CA, USA) and measured with a digital power meter (Model 66202, Chroma, Foothill Ranch, CA, USA). The electric power measured represents the “wall plug” or total power used by the lamp or fixture and includes any power drawn by a ballast, driver, or cooling fan.
 
Additional light measurements were conducted in a 3 by 4 m darkroom equipped with a spectroradiometer (Model PS-300, Apogee Instruments, Logan, UT, USA). The vertical distance between the bottom of the lamp bulb (or transparent cover in the case of some LED fixtures) and the sensor head was maintained at 61 cm. All measurements reported in this paper were measured directly below the center of the lamp bulb(s) or fixture.
 

2.3. Environmental Conditions

All lamp testing was performed at temperatures ranging between 20 and 25 °C, and relative humidity conditions ranging between 30% and 50%. The temperature inside the integrating sphere was maintained by closing the integrating sphere for only a short period of time (less than 20 s) during data collection. Immediately after data collection, the integrating sphere was opened again, allowing the inside temperature to return to laboratory conditions.
 

2.4. Calibration

All measurement equipment was calibrated according to manufacturer specifications and recommended frequency. When recommended, equipment was returned periodically to the manufacturer for recalibration.


2.5. Definitions and Calculations
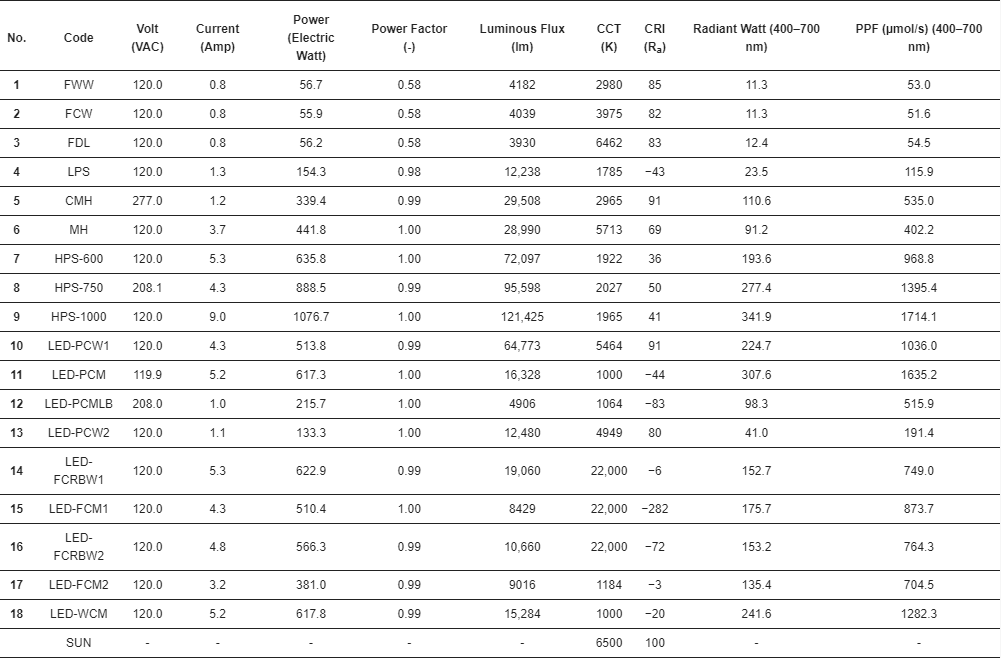
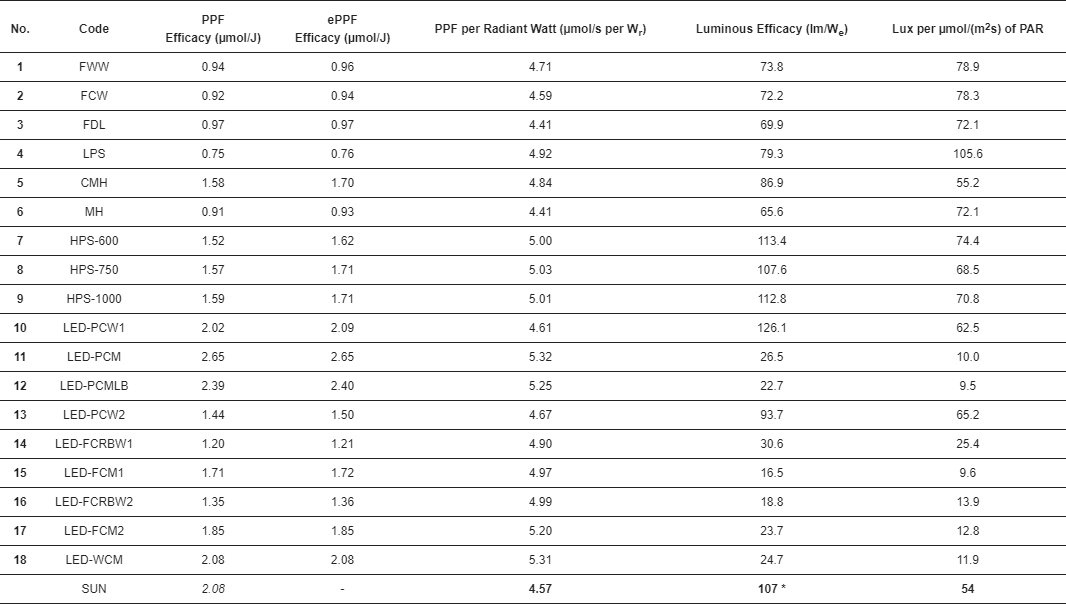
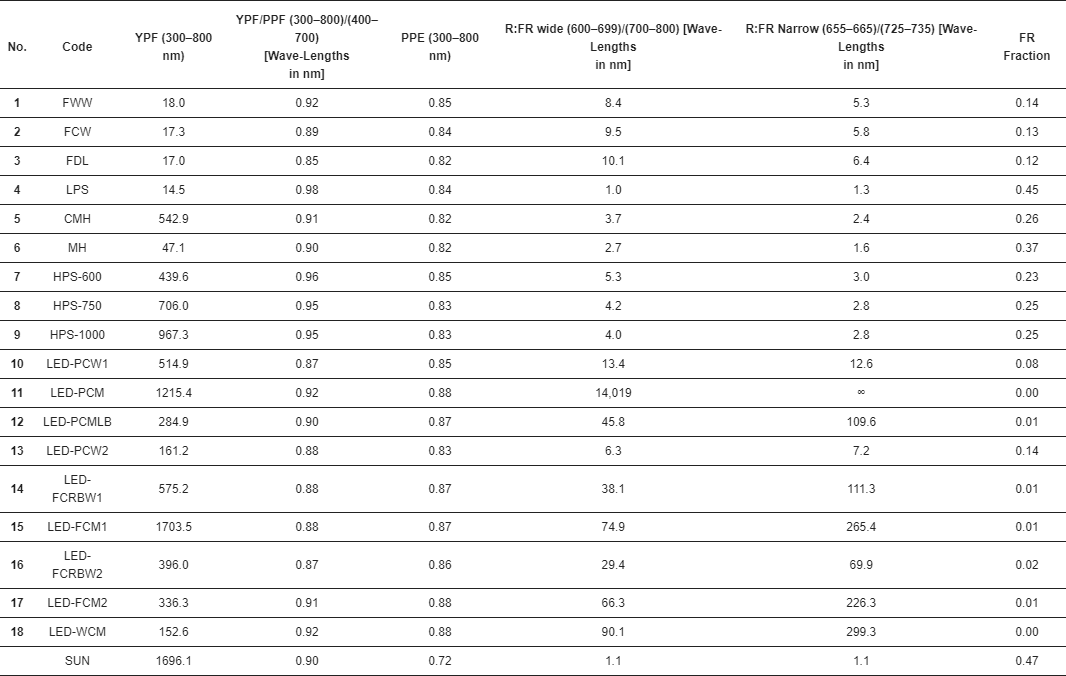
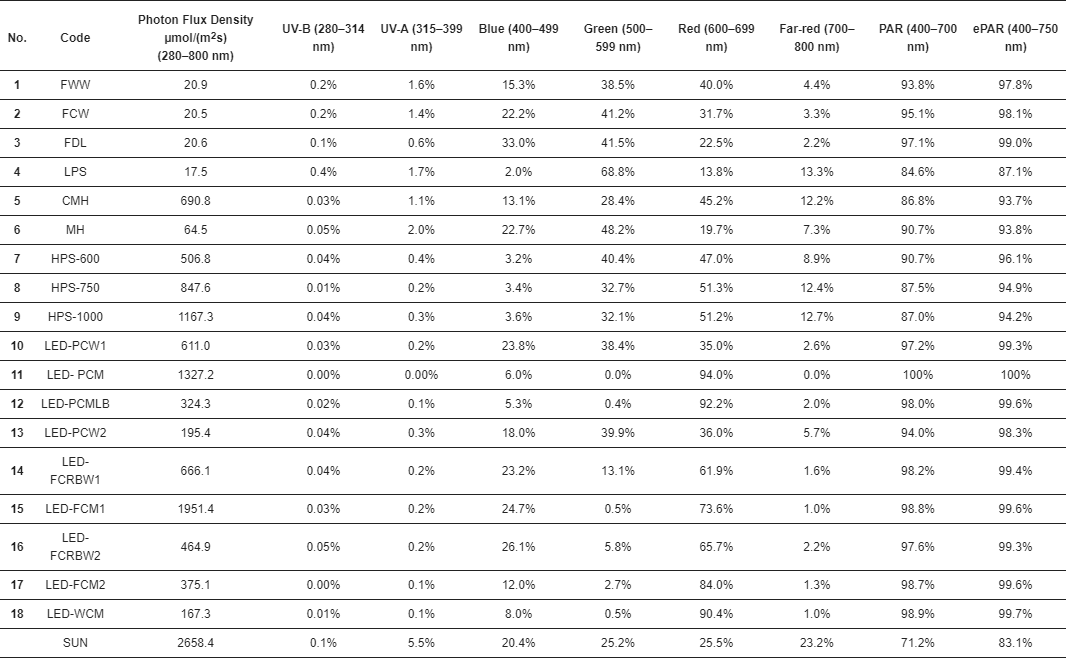
Photosynthetically active radiation (PAR) was measured across the 400–700 nm waveband, while giving equal weight to each of the photons across that waveband. An equivalent measurement is the photosynthetic photon flux density (PPFD). Both have the units µmol/(m2s). The photosynthetic photon flux (PPF) covers the same waveband, but has units of µmol/s [13].
 
The extended photosynthetically active radiation (ePAR) waveband was proposed by [14,15] and covers the 400–750 nm waveband. Note that a similar acronym (EPAR) was proposed by [16], who used the 290–850 nm waveband to define the term extended PAR. Using the concept of ePAR, the extended photosynthetic photon flux (ePPF) can be used to calculate the extended efficacy (ePPF divided by the electric power consumption) for a light source.
 
The yield photon flux (YPF) was calculated according to the definition used by [17]. It covers the 360 to 760 nm waveband and weighs each photon according to the relative quantum efficiency curve [18,19].
 
The phytochrome photoequilibrium (PPE) was calculated according to the method described in [19], and covers the 300 to 800 nm waveband. An equivalent term for this parameter is the phytochrome photostationary state (PSS). The calculation involves the spectral composition of light before it interacts with plant tissue. Note that [20] proposed to modify the calculation of the PPE so as to account for spectral distortions that occur as light interacts with leaf tissue.
 
The far-red (FR) fraction was calculated using an equation proposed by [21]: FR fraction = FR/(R + FR), with FR defined as the photon flux across the 730 ± 10 nm waveband, and red (R) as the photon flux across the 655 ± 10 nm waveband.
 

3. Results

Figure 1 and Figure 2 show the normalized spectral output across the 300–800 nm waveband for the various lamps evaluated. Figure 3 shows the normalized spectral output across the 300–800 nm waveband for sunlight. The normalization was carried out by dividing all the spectral output values by the largest spectral output value across the 300–800 nm waveband. In Table 1, the various light sources evaluated are identified. Table 2 through 5 show the measurement values from the tests performed in the integrating sphere and the darkroom, as well as the measurement results from the solar scan.
Agriengineering 03 00046 g001 550
Figure 1. Normalized spectral output across the 300–800 nm waveband for nine different light sources. Original data measured as photon flux density with a spectroradiometer (Model PS-300, Apogee Instruments, Logan, UT, USA) in the units µmol/(m2s) per nm. Horizontal axes: wavelength in nm, vertical axes: normalized spectral output (unitless).
 
 
Agriengineering 03 00046 g002 550
Figure 2. Normalized spectral output across the 300–800 nm waveband for nine different LED fixtures. Original data measured as photon flux density with a spectroradiometer (Model PS-300, Apogee Instruments, Logan, UT, USA) in the units µmol/(m2s) per nm. Horizontal axes: wavelength in nm, vertical axes: normalized spectral output (unitless).
 
 
Agriengineering 03 00046 g003 550
Figure 3. Normalized photon flux for solar radiation measured on a clear day near the summer solstice and around solar noon (25 June 2015 in New Brunswick, NJ, USA). Original data measured as photon flux density with a spectroradiometer (Model PS-300, Apogee Instruments, Logan, UT, USA) in the units µmol/(m2s) per nm. Total photosynthetically active radiation (400–700 nm): 1894 µmol/(m2s).


Table 2. Measurement results from tests conducted in the integrating sphere. CCT = Correlated color temperature, CRI = Color rendering index, Ra = International standard for color rendering index (unitless), PPF = Photosynthetic photon flux.
hortT2.png


4. Discussion

For this study, we evaluated single lamps or fixtures as the representative of a particular lamp type. We did not inform the manufacturers we were performing our tests, so we have no reason to believe that the specific lamps or fixtures we tested were selected for atypical performance. Nevertheless, it is not possible to draw conclusions about the typical performance of the lamps or fixtures we tested. The purpose of our tests was not to call out specific manufacturers about their products, but rather show the range of performance characteristics among light sources commonly used for horticultural applications. Additionally, since LED technology is developing rapidly, it is likely that the information on LED lamps presented here will be outdated in a few years.
 
The spectral output of the various lamps we evaluated were measured with spectroradiometers with calibrated detection ranges of approximately 300–1000 nm. As a result, little infrared (heat) radiation was detected. It is well known that some lamps (e.g., HID lamps) produce substantial amounts of infrared radiation, and this can be an important consideration when deciding on which lighting system is most appropriate for a particular installation. An approximation for the amount of infrared radiation produced by each lamp is the difference between the electric power consumed by the lamp and the radiant energy delivered (Table 2), but such an approximation neglects any passive or forced convective heat losses. However, any amount of radiant or convective energy produced by a lamp will eventually be converted into heat (first law of thermodynamics).
 
The scientific literature contains little information about the independent testing of a variety of lamp types used for horticultural applications. An exception is the report published by [22], who conducted an electrical and photometric evaluation of ten LED lamps, two HPS lamps, and one MH lamp. However, [22] contains only partial information about the spectral distribution across the 280–800 nm waveband.
 
The electrical metrics reported in Table 2 (volt, current, power, and power factor) can be used to assess the power requirements and performance characteristics of specific lamp types. Lamps operated with electronic ballasts (fluorescent, and HID lamps) or drivers (LED lamps) often can be operated at several different supply voltages. The higher the voltage used, the lower the current draw and this feature can be used to save on installation costs because smaller diameter wires can be used when the current draw is lower. The power factor indicates how much of the supplied power is used to do useful work. A value of 1 indicates that 100% of the supplied power performs useful work (i.e., operates the lamp), while lower numbers indicate that some percentage of the supplied power is lost (i.e., does not perform useful work).
 
Table 2 also reports on three performance characteristics that describe some of the visual aspects of light (lumen output, correlated color temperature, and color rendering index). These characteristics are not particularly useful for horticultural applications, but do allow for comparisons with light sources that are used for human vision applications (e.g., residential and commercial lighting). In addition, the color rendering index provides some insight into how easy it is to observe leaf color when the leaves are lit with a particular light source. This can be important when growers want to observe discolorations due to plant nutritional issues or damage due to insects or plant diseases.
 
Table 3 shows the lamp efficacy values that were calculated from the measurements performed in the integrating sphere. Efficacy data is one of the key performance metrics that are used to evaluate lamp performance. The numbers we report are not always as high as those reported by the manufacturers. There could be several reasons for this, but since our sample size was only one, it is not possible to determine which number is correct. Nevertheless, since our tests were performed using the same procedures and equipment, the relative differences among the various lamp types can be used for comparisons.
 
Table 3. Values derived from the measurements conducted in the integrating sphere. Values for sunlight in italics from [23], and in bold from [12]. PPF = Photosynthetic photon flux (400–700 nm), ePPF = Extended photosynthetic photon flux (400–750 nm), Wr = radiant Watt, We = electric Watt.
hortT3.png
 
Table 3 also reports on performance characteristics that involve visible light. As mentioned before, assessing visible light for horticultural applications is not very useful, but the performance characteristics involving visible light that are included in Table 3 can be used to compare our measurements with those reported in the literature (e.g., [12]).
 
Table 4 reports on several additional light parameters that are used by plant scientists to further qualify the light environment for plant production. These parameters include the yield photon flux (YPF), the ratio of the YPF and the photosynthetic photon flux (PPF), the phytochrome photoequilibrium (PPE), and three different ways to assess the amount of far-red that is present in the produced light spectrum. In each of these three different approaches, the definition (i.e., its waveband) of far-red light is different. Other definitions of far-red light have also been used, but the point here is to show that these different definitions can lead to quite different calculation results.
 
Table 4. Values derived from measurements conducted in the dark room with a spectroradiometer (Model PS-300, Apogee Instruments, Logan, UT, USA), except for the values for sunlight which were obtained from an outdoor spectral scan using the same spectroradiometer. YPF = Yield photon flux, PPF = Photosynthetic photon flux, PPE = Phytochrome photoequilibrium.
hortT4.png
 
It is common for researchers to identify the blue, green, and red wavebands by the 400–500 nm, 500–600 nm, and 600–700 nm ranges, respectively. However, this practice double-counts the radiation output at 500 and 600 nm. Therefore, we used non-overlapping wavebands to report the radiation output across the various wavelength ranges (Table 5).
 
Table 5. Light distribution ratios as a percentage of the photon flux density across the 280–800 nm waveband as measured with a spectroradiometer (Model PS-300, Apogee Instruments, Logan, UT, USA). The values were calculated from measurements conducted in the dark room, except for the values for sunlight which were obtained from an outdoor spectral scan. UV = Ultraviolet, PAR = Photosynthetically active radiation, ePAR = Extended photosynthetically active radiation.
hortT5.png
 
As this paper demonstrated, careful measurement of lamp characteristics is necessary so that sufficient information can be reported. Only reports with sufficient information will enable the repeatability of plant lighting research. Detailed reports will also help commercial growers make more informed decisions about plant lighting options. The range of performance characteristics disclosed in this paper highlight the importance of lamp selection for a particular horticultural application. In a perfect world, performance characteristics would be made available by lamp manufacturers, but that is not always the case, or the information is incomplete. Researchers and growers are encouraged to ask manufacturers for detailed information about the lighting products they are considering.
 

5. Conclusions

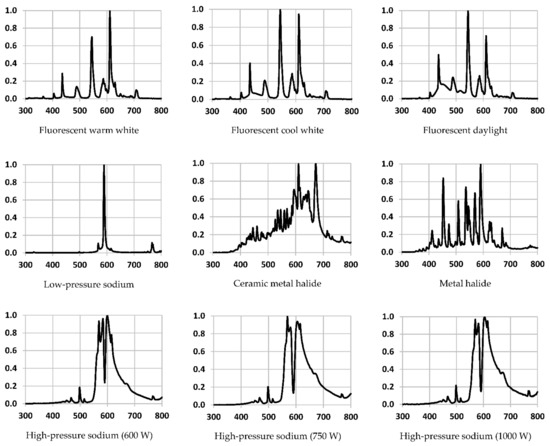
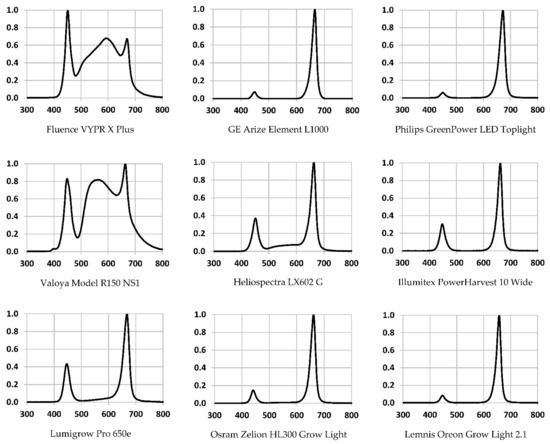
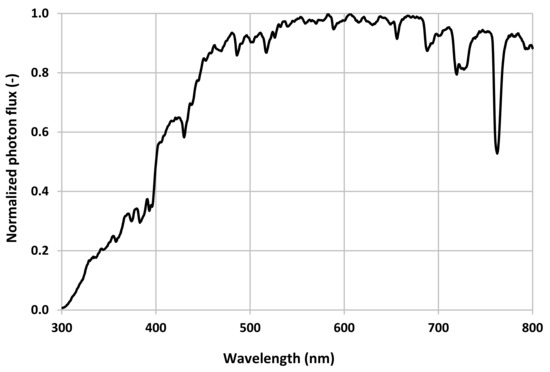
  • Every light source tested had unique performance characteristics, including their spectral outputs.
  • The PPF efficacy of a light source is but one performance characteristic that should be considered.
  • A spectroradiometer is needed in order to assess the spectral output of a light source.
  • Changing the definition of PAR will make it more difficult to compare published results that used the current definition for PAR (400–700 nm) with results published based on the extended definition for PAR (ePAR, 400–750 nm).
  • The sooner the scientific community can agree on definitions that describe key performance characteristics (e.g., waveband ranges, photosynthetically active radiation), the less confusion there will be when these performance characteristics are used to make plant lighting decisions.
  • Due to the rapidly improving LED technology, it is critically important to have a consistent system for measuring and reporting lamp characteristics.
  • Due to the challenges involved, commercial growers are encouraged to experiment with new light sources on a small growing area, before deciding to scale up to large production areas.


Author Contributions

Conceptualization, A.-J.B.; methodology, T.J.S. and A.-J.B.; data collection and analysis, T.J.S. and A.-J.B.; data curation, T.J.S. and A.-J.B.; writing—original draft preparation, A.-J.B.; writing—review and editing, T.J.S. and A.-J.B.; visualization, A.-J.B.; supervision, A.-J.B.; project administration, A.-J.B.; funding acquisition, A.-J.B. All authors have read and agreed to the published version of the manuscript.

Funding

This research was funded by the New York State Energy Research and Development Authority (Greenhouse Lighting and Systems Engineering–GLASE–project) and the New Jersey Agricultural Experiment Station.

Data Availability Statement

Original measurement data available on request from the authors.

Acknowledgments

The authors gratefully acknowledge the help they received from Claude Wallace who conducted several of the lamp evaluation tests.

Conflicts of Interest

The authors declare no conflict of interest. The funders had no role in the design of the study; in the collection, analyses, or interpretation of data; in the writing of the manuscript, or in the decision to publish the results.

References

  1. Mitchell, C.A.; Burr, J.F.; Dzakovich, M.J.; Gómez, C.; Lopez, R.; Hernández, R.; Kubota, C.; Currey, C.J.; Meng, Q.; Runkle, E.S.; et al. Light-Emitting Diodes in horticulture. In Horticultural Reviews; John Wiley & Sons Inc.: Hoboken, NJ, USA, 2015; Volume 43, pp. 1–87. [Google Scholar]
  2. Pattison, P.M.; Tsao, J.Y.; Brainard, G.C.; Bugbee, B. LEDs for photons, physiology and food. Nature 2018, 563, 493–500. [Google Scholar] [CrossRef] [PubMed]
  3. Massa, G.D.; Kim, H.H.; Wheeler, R.M.; Mitchell, C.A. Plant productivity in response to LED lighting. HortScience 2008, 43, 1951–1956. [Google Scholar] [CrossRef]
  4. Bugbee, B. Toward an optimal spectral quality for plant growth and development: The importance of radiation capture. Acta Hortic. 2016, 1134, 1–12. [Google Scholar] [CrossRef]
  5. Nelson, J.A.; Bugbee, B. Economic analysis of greenhouse lighting: Light emitting diodes vs. high intensity discharge fixtures. PLoS ONE 2014, 9, e99010. [Google Scholar] [CrossRef]
  6. Katzin, D.; Marcelis, L.F.M.; van Mourik, S. Energy savings in greenhouses by transition from high-pressure sodium to LED lighting. Appl. Energy 2021, 281, 116019. [Google Scholar] [CrossRef]
  7. Lopez, R.; Runkle, E.S. (Eds.) Light Management in Controlled Environments; Meister Media: Willoughby, OH, USA, 2017; 180p. [Google Scholar]
  8. Mickens, M.A.; Skoog, E.J.; Reese, L.E.; Barnwell, P.L.; Spencer, L.E.; Massa, G.D.; Wheeler, R.M. A strategic approach for investigating light recipes for ‘Outredgeous’ red romaine lettuce using white and monochromatic LEDs. Life Sci. Space Res. 2018, 19, 53–62. [Google Scholar] [CrossRef] [PubMed]
  9. Wallace, C.; Both, A.J. Evaluating operating characteristics of light sources for horticultural applications. Acta Hortic. 2016, 1134, 435–444. [Google Scholar] [CrossRef]
  10. Both, A.J.; Bugbee, B.; Kubota, C.; Lopez, R.G.; Mitchell, C.; Runkle, E.S.; Wallace, C. Proposed product label for electric lamps used in the plant sciences. Hort. Technol. 2017, 27, 544–549. [Google Scholar] [CrossRef]
  11. Shelford, T.; Wallace, C.; Both, A.J. Calculating and reporting key light ratios for plant research. Acta Hortic. 2020, 1296, 559–566. [Google Scholar] [CrossRef]
  12. Thimijan, R.W.; Heins, R.D. Photometric, radiometric, and quantum light units of measure: A review of procedures for interconversion. HortScience 1983, 18, 818–822. [Google Scholar]
  13. ANSI/ASABE Standard S640. Quantities and Units of Electromagnetic Radiation for Plants (Photosynthetic Organisms); American Society for Agricultural and Biological Engineers: St. Joseph, MI, USA, 2017. [Google Scholar]
  14. Zhen, S.; Bugbee, B. Far-red photons have equivalent efficiency to traditional photosynthetic photons: Implications for redefining photosynthetically active radiation. Plant Cell Environ. 2020, 43, 1259–1272. [Google Scholar] [CrossRef] [PubMed]
  15. Zhen, S.; van Iersel, M.; Bugbee, B. Why far-red photons should be included in the definition of photosynthetic photons and the measurement of horticultural fixture efficacy. Front. Plant Sci. 2021, 12, 693445. [Google Scholar] [CrossRef] [PubMed]
  16. Pazuki, A.; Aflaki, F.; Pessarakli, M.; Gurel, E.; Gurel, S. Plant responses to extended photosynthetically active radiation (EPAR). Adv. Plants Agric. Res. 2017, 7, 00260. [Google Scholar]
  17. Barnes, C.; Tibbitts, T.; Sager, J.; Deitzer, G.; Bubenheim, D.; Koener, G.; Bugbee, B. Accuracy of quantum sensors measuring yield photon flux and photosynthetic photon flux. HortScience 1993, 28, 1197–1200. [Google Scholar] [CrossRef]
  18. McCree, K.J. The action spectrum, absorptance and quantum yield of photosynthesis in crop plants. Agric. Meteorol. 1972, 9, 191–216. [Google Scholar] [CrossRef]
  19. Sager, J.C.; Smith, W.O.; Edwards, J.L.; Cyr, K.L. Photosynthetic efficiency and phytochrome photoequilibria determination using spectral data. Transact. ASAE 1988, 31, 1882–1889. [Google Scholar] [CrossRef]
  20. Kusuma, P.; Bugbee, B. Improving the predictive value of phytochrome photoequilibrium: Consideration of spectral distortion within a leaf. Front. Plant Sci. 2021, 12, 596943. [Google Scholar] [CrossRef] [PubMed]
  21. Kusuma, P.; Bugbee, B. Far-red fraction: An improved metric for characterizing phytochrome effects on morphology. J. Am. Soc. Hortic. Sci. 2021, 146, 3–13. [Google Scholar] [CrossRef]
  22. Radetsky, L.C. LED and HID Horticultural Luminaire Testing Report; Lighting Research Center, Rensselaer Polytechnic Institute: Troy, NY, USA, 2018; 80p. [Google Scholar]
  23. Ting, K.C.; Giacomelli, G.A. Availability of solar photosynthetically active radiation. Transact. ASAE 1987, 30, 1453–1457. [Google Scholar] [CrossRef]


Reprinted from:  Advanced Lighting Technologies in Controlled Environment Agriculture for Production, Breeding, and Research


Don’t miss the next big lighting story…

Click here to subscribe to the inside.lighting InfoLetter
Just 3-4 emails per month and it’s easy to unsubscribe


OTHER NEWS