

Lighting Revenues: Where is the Bottom?
Publicly traded lighting companies have been reporting steep declines for the most recent quarterly results that included COVID-19 lockdowns in the U.S and Canada. We wanted to dig a little deeper into the revenues and losses. We set out to dissect and estimate revenues for some of these companies by quantifying the North American lighting revenue that is being lost compared to the same quarter last year.
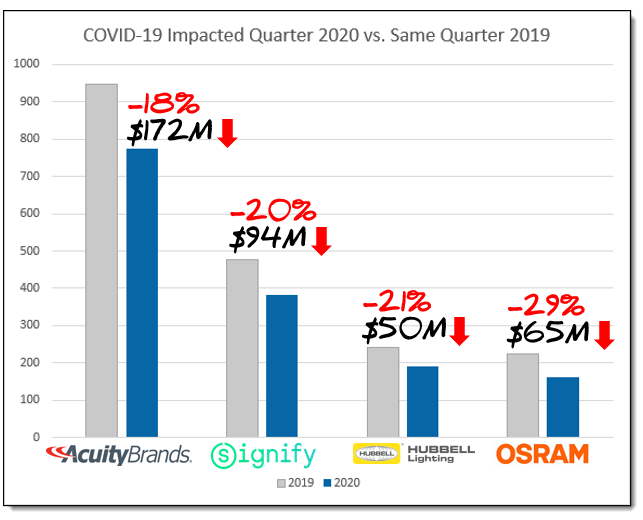
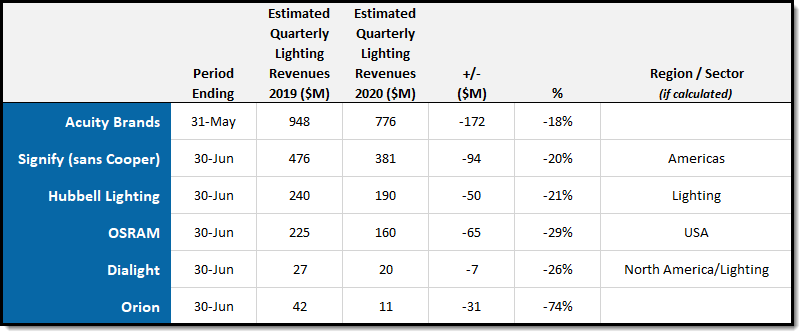
The charts above and below reflect reported sales numbers for Acuity Brands and Orion. All other sales figures are estimates with many assumptions relating to geographic region (for globally diversified companies like Osram and Signify), Lighting sector (for companies like Hubbell whose revenues are mainly non-Lighting) and currency conversion. While we strive to be as accurate as possible, many of these numbers are estimates and based on pro rata calculations. All of the detailed notes and disclaimers are below.
Estimated Lighting Revenues Americas, North America, USA ($USD)
Based on the percentage drops above, it looks like Acuity Brands may have been the least damaged by COVID-19 impact, but an important distinction to make is that their quarter ended May 31, while others ended June 30. Based on the timing of COVID-19 lockdowns in March, the entire Acuity Brands March - May quarter wasn't impacted by COVID-19 the same way other company's April - June quarters were.
Notes
- Signify sales estimates do not include Cooper Lighting and DO include consumer and lamp segments.
- For more details on Signify's 2020 Q2 click here.
- Full notations and methodology cited at bottom of article.
Notable publicly traded omissions:
- Legrand financials do not carve out Lighting segment, so we didn't include Legrand.
- LSI Industries releases Q4 results on Aug 20.
- Energy Focus releases Q2 results on Aug 14.
Is the bottom still ahead of us? We think so.
As we talk to lighting people in various lighting markets in the U.S. and Canada, we are learning that the current quarter we are in right now, might prove to hit even lower marks for revenue and profit. Architectural design billing activity points towards a slow 6-12 months ahead. Contractor spending and contractor confidence continue to decrease.
Four questions to explore further:
1. With significant drops in new orders during recent months, what impact will the vastly reduced backlog have on Q3 and Q4 revenues?
Revenues for periods ending in May and June were certainly affected by construction site shutdowns in many regions. However, those same revenues were also fueled by backlog orders that entered the pipeline January to mid-March before the effects of COVID-19 related shutdowns were fully realized.
2. How will UV sales impact revenues and profits?
One of the hottest current topics in lighting is UV-C disinfection. While UV-related revenue gains will likely be much smaller than the general lighting revenue losses, it's possible that UV sales occur at higher margins. This higher-margin sale could cause some end of quarter profit margins to take a smaller hit compared to the top-line revenues.
3. Will cash flow change Lighting Agent behavior?
Cash flow concerns are hitting most businesses these days. To help keep their businesses moving, it is possible that lighting agents will try to steer even more of their revenues towards larger conglomerate manufacturers that pay commission on invoice vs. smaller independent lines that pay commission up to 30 days after they get paid by the distributor (who may have 30-60 day terms).
4. Are lighting brands with consumer products better equipped to weather the storm?
Home Depot and Lowe's sales and profits are doing really well during the pandemic. With COVID-19 do-it-yourself home improvements on the rise, will brands with a big presence in DIY channels and consumer product categories have more solid footing than other brands that play in mainly traditional C&I channels?
Important notes, assumptions and methodology
- Many of the numbers above are estimates and involve many assumptions based on business segmentation, geography, performance, etc.
- Osram and Signify currency conversions: USD = EUR x 1.15
- Dialight currency conversions: USD = GBP x 1.25
- OSRAM estimates are for USA and assume 23% of total global sales
- Hubbell estimates assume Lighting segment is 20% of total global sales
- Dialight quarterly revenue estimates are prorated for 78% North America, 74% Lighting segment and 50% of "Half Yearly" financial statements
- Prorated percentage numbers for geography and business segments are derived from the company's most recent annual report.
- All revenue figures for U.S.-based companies are sourced from Fidelity Investments.
- All figures for non-U.S. companies are sourced from the Investor Relations section of the company website.
- Estimating Signify sales involves much conjecture due to the acquisition of Cooper Lighting Solutions on Mar 2, 2020.
- Signify estimates are for Americas and assume 28% of total global sales without Cooper Lighting.
- Cooper Lighting Solutions is not included in 2019 Signify estimates.
- Cooper Lighting Solutions estimated 2020 Q2 revenue of 285M EUR ($328M USD) is backed out of Signify Q2 2020 estimated total before any other calculations.
- Signify estimates include consumer and lamp segments
- Not responsible for typographical errors or mathematical miscalculations.
- The author of this article, Al Uszynski, holds stock with Osram, does not hold a position with any other companies mentioned and has no plans to initiate any such positions within the next 15 days.
Don’t miss the next big lighting story…Click here to subscribe to the inside.lighting InfoLetter |